How can restaurant owners manage recent revenue and payroll trends? Insights from NEXT data.

How can restaurant owners manage recent revenue and payroll trends? Insights from NEXT data.

Tong Zhang
By Tong Zhang
Sep 24, 2024
12 min read

Restaurant owners are having a record-breaking year. With sales expected to exceed $1.1 trillion in 2024, the industry is experiencing its best year yet, according to the National Restaurant Association, despite rising economic pressures.

But if you own a small restaurant, this optimistic outlook may feel like it’s in stark contrast to your day-to-day reality. Succeeding in the restaurant industry has never been easy, and that’s especially true now with inflation, rising payroll costs and a tight labor market.

At NEXT Insurance, we understand the unique challenges of running a small business. We provide tailored business insurance for more than 500,000 business owners, including tens of thousands of restaurants and other food and beverage ventures.

To better understand the biggest pain points and opportunities for small restaurant owners right now, we analyzed anonymized NEXT data related to revenue, payroll and employee headcount from 30,000 small business restaurants.

We also compared this to third-party cost-of-living data to provide restaurant owners and employees with added financial insight.

Continue reading to learn the real numbers behind the macroeconomic pressures small restaurants are facing; how your restaurant measures up against your peers in terms of revenue, payroll and employee headcount; and tips to help ensure the financial security of your business.

For additional insights into how small restaurants are faring, you can check out our restaurant insurance claims report “How to protect your business from the most common and costly insurance claims.”

Jump ahead to key findings and expert tips:

Restaurant payroll outpaces revenue growth

How do your revenue and payroll compare to other restaurants across the United States — and down the street?

As you work to achieve or maintain financial stability, it’s helpful to measure against other restaurants to see where your finances align with national and regional averages.

We used our data to peel back the curtain on how much revenue restaurants are making and how much they are paying in payroll costs.

Industry revenue averages and opportunities to increase revenue

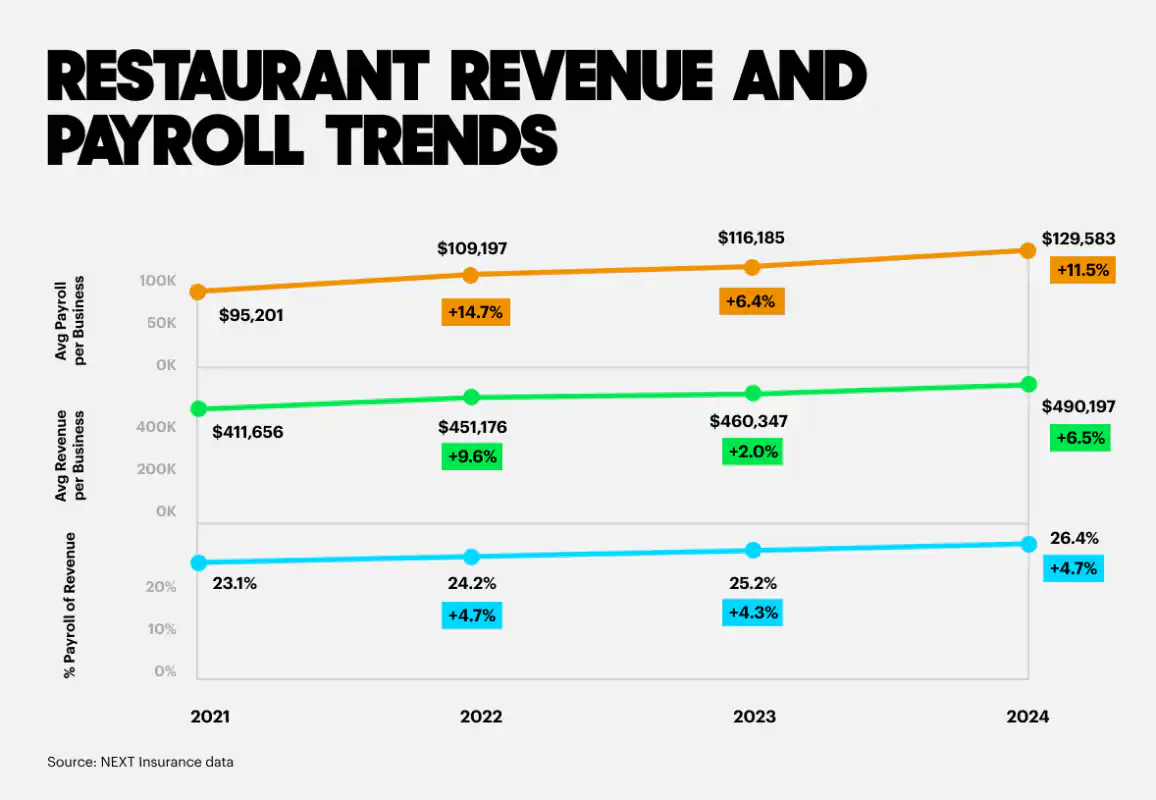
The good news is our data shows restaurant revenue has increased 6% annually since 2021. The projected average revenue per restaurant in 2024 is $490,197 compared to $411,656 in 2021.

This is sizable growth across all types of restaurants, but the biggest year-over-year revenue gains from 2022 to 2024 are in quick service and casual dining restaurants. Fine dining businesses saw a small drop in revenue.

Revenue changes by restaurant type:

  • Quick service restaurant revenue increased 4.1%, from $392,021 in 2022 to a projected $408,066 in 2024.
  • Casual dining revenue increased 6.3%, from $503,164 in 2022 to a projected $534,866 in 2024.
  • Fine dining revenue decreased 1.5%, with revenues of $639,936 in 2022 to a projected $630,237 in 2024.

This data reveals consumer purchasing behavior trends that all restaurant owners can learn from. Despite Americans spending a third of their income on food, the highest it’s been in decades, consumers are more conscious about how they spend their money.

You could adopt strategies to help with value perception. For example:

  • Offer daily or weekly specials.
  • Work on plating so food looks plentiful and like a good value.
  • Use your menu to tell a story about your ingredients and explain costs. For example, if you explain that a meal includes hand-harvested saffron, your customer is more likely to understand and tolerate a higher cost.

You could also consider other cost-saving strategies besides simply increasing prices, which your market may not bear:

  • Eliminate items to streamline your menu.
  • Reduce the amount of inventory you carry.
  • Find more affordable ingredients wherever possible.

Industry payroll averages and tips to control payroll costs

While revenue is rising, we’re also seeing payroll costs increase. Payroll is often one of the largest operating expenses for a restaurant, so this increase has significant implications for the financial well being of your business.

Payroll has increased an annual average of 10.9% from $95,201 in 2021 to a projected $129,583 in 2024, according to our data. In 2021, payroll made up 23% of revenue — that percentage of revenue is expected to increase to more than 26% in 2024.

Interestingly, payroll costs are increasing — but employee headcount is not. In 2021, restaurants had an average of 6.51 employees. In 2024, the average number of employees dropped slightly to 6.03 employees.

Restaurant Data Chart revenue and payroll trends

If your payroll expenses are measuring on the high side, you should consider taking steps to bring that number down.

Here are some suggestions for reducing labor costs:

  • Practice informed scheduling. Try to strike the right balance of number of employees per shift. Too few employees on the schedule, customer service and employee morale can suffer. But when you’re overstaffed, employees can feel disengaged — and their tips can suffer, too.
  • Adjust schedules based on your sales forecast. Take a long view by making scheduling decisions not just by the day but also by the month and season.
  • Cross-train. Employees who can work different jobs can fill in and do double-duty on slow shifts. For example, a host who can bus or a waiter who can manage reservations during setup. It saves on labor costs while at the same time empowering your staff to learn new skills.
  • Control overtime. Sometimes overtime is avoidable. But if you’re able to stay on top of employee hours, you can make smart decisions that will minimize expensive overtime hours.
  • Use new restaurant technology. There’s lots of new tech out there that can help save on labor costs, such as self-service ordering.

In an industry that often has tight margins, a few percentage points can make a big difference to a business’s bottom line.

States with the highest restaurant payroll costs

Some states are feeling the payroll crunch more than others. How does your state compare?

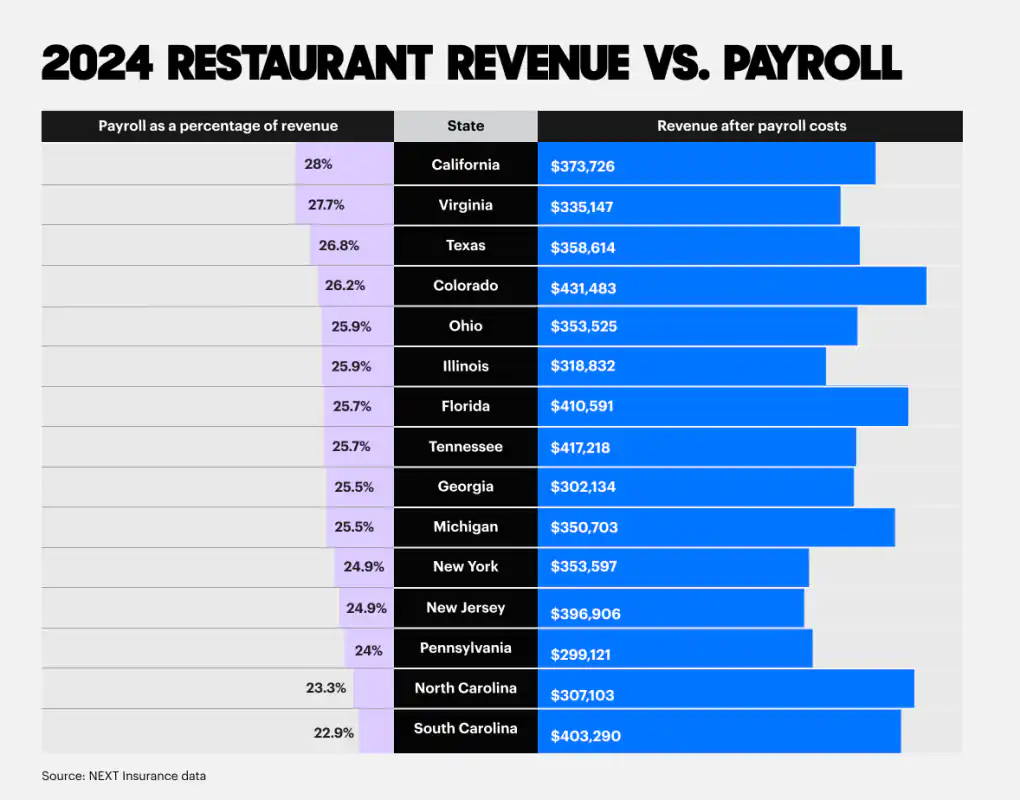
Profitability can be defined not just by total revenue but also by net revenue after significant expenses. With payroll costs making up more than a quarter of restaurant expenses, according to our data, it’s interesting to look at revenue after payroll costs to have a clearer view of profitability.

To assess profitability through this lens, we took another cut of our data, focusing on states with at least 150 NEXT restaurant customers. Within this data subset, we see Colorado has one of the higher payroll percentages, but it also has the highest average restaurant revenue after payroll expenses at $431,483.

Individual cities within Colorado with high minimum wage could drive these high payroll expenses. Denver has a minimum wage of $18.29 an hour, which exceeds Colorado’s state minimum wage of $14.42.

On the other end of the spectrum, we find California taking the hit of the highest payroll percentage of revenue at 28%.

Restaurant Data Chart revenue vs payroll

So why is payroll up while headcount is down?

There could be a number of contributing factors, but these rising payroll costs are likely due to macroeconomic factors such as inflation and rising minimum wages in 25 states in January 2024.

Hourly wages across many states now far exceed the federally mandated minimum of $7.25, with Washington, D.C., topping the list at $17 an hour and Washington and California not far behind with $16.28 and $16, respectively.

If you’re a restaurateur looking to open your first restaurant and/or expand, you should factor in these wage requirements and regional differences as you think about locations.

Employee wages aren’t keeping up with the cost of living

Restaurant employee wages are up nationally. How do your employees compare in terms of wages? Are you paying them enough to keep them from seeking out other opportunities? (Tips are, of course, an important part of this equation as well — but one not tracked by our small restaurant customers and therefore not included in this data analysis.)

Data from Square going back to 2017 shows that average hourly earnings for restaurant workers has increased 66% — while over the same time period, retail workers experienced an increase of just 40%. In other words, restaurant wages aren’t just increasing in parallel to the cost of living.

But even with these high industry averages — and even though your employees’ wages probably feel higher than ever — the average U.S. restaurant employee’s wages still falls below the cost of living in most states.

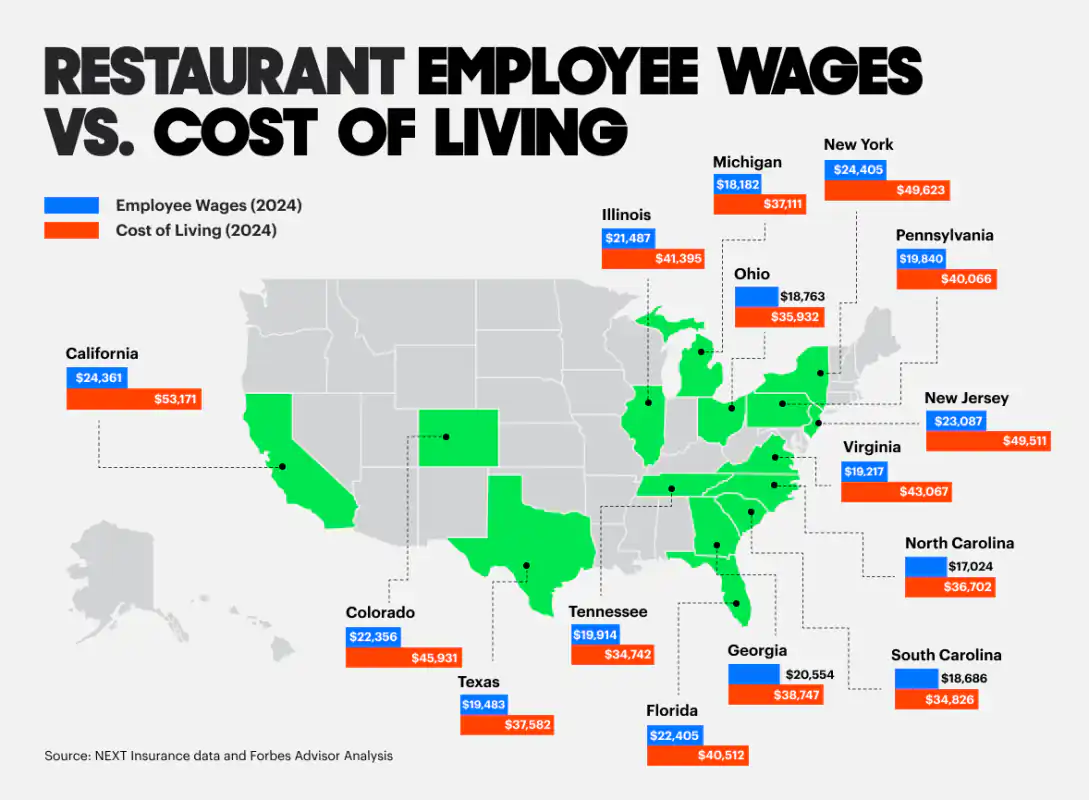
When we look at NEXT data for employee wages compared to cost-of-living data from Forbes, we see a large gap:

  • New York has the highest restaurant average employee wages at $24,405 annually, which is less than half of the cost of living at $49,623.
    The biggest discrepancy between wages and cost of living is in Virginia, where average wages ($19,217) are just 44.6% of the cost of living ($43,067).
Restaurant Data Chart employee wages vs cost of living

Tips to retain restaurant employees in a tight labor market

What does this mean for restaurant owners? In a tight labor market, it could be harder to find qualified staff if you are competing against other industries that offer better pay. That’s why it’s more important than ever to focus on retaining your staff.

Beyond treating your workers well and providing adequate support and training, here are some helpful tips for employee retention:

  • Offer competitive pay. Good pay isn’t the only way to retain employees, but it obviously helps. When you’re calculating your compensation structure, factor in the cost of recruiting, hiring and onboarding new employees. It might be more cost-effective to retain employees instead of regularly backfilling positions.
  • Support work-life balance. Giving your employees more flexibility shows them that you care about them and appreciate that they have lives outside of your restaurant. Ask employees to share their ideal schedules (and do your best to accommodate), track employee hours and check in with workers to make sure nobody is getting burnt out. Consider offering an “on-call” model so employees can pick up shifts when they’re able.
  • Create consistency. The more you can help create consistency for your employees, the more they know what to expect from every shift. This can help them to manage their workload and stress levels. Consider things like creating regular schedules, regular sections and regular opening responsibilities.
  • Cross-train. Cross-training is a tip for reducing labor costs, but it also does double duty in helping with employee retention. Helping your employees to develop additional skills is good for their professional development — and shows you’re invested in their success.
  • Implement a transparent management style. How can you help make your employees feel invested in the shared success of your restaurant? Adopt a transparent management style where you educate your employees on the back-office metrics that define success for your business. If a dishwasher understands your profit margins, it can help them feel more engaged and invested in the success of your business.

Restaurant outlook and next steps
With revenues rising, restaurant ownership looks like a smart small business decision.

But we know that running a small business is challenging. Twenty percent of small businesses fail in their first year and 50% fail after five years, according to the Bureau of Labor Statistics. So, for a small business restaurant to survive, it needs more than a steady increase in revenue.

You can’t control the macroeconomics, but you can control how you react to them in order to optimize your chances of survival. Consider these tips:

  • Closely monitor payroll costs as a key indicator of the financial health of your restaurant, and try to find ways to reduce these costs — without sacrificing the well-being of your employees or customer service.
  • Make employee retention a priority. According to a recent survey from the National Restaurant Association, eight out of 10 restaurant owners currently have job openings that they say are hard to fill. A focus on employee retention spares you from having to compete for new employees in a tight labor market.
  • Subscribe to NEXT’s monthly newsletter for more info, insights and tips for running a small restaurant. Owning a restaurant can be a lonely business, but we’re here — with our firsthand knowledge from tens of thousands of small restaurants — to help your business succeed.
  • Get an instant quote from NEXT for customized coverage to help protect your business.
banner get business insurance in 10

About NEXT Insurance

We’re NEXT, an insurance company that focuses on providing fast and customized business insurance for entrepreneurs.

That means we can provide you with top-quality insurance options and dedicated claims advocates that protect you from the unique risks your business faces every day. If you need help, our small business experts are ready to support you from start to finish.

See why more than 500,000 small businesses from 1,300 professions turn to NEXT to get the protection they need.

Start a free quote online today.

Methodology

This report contains anonymized data from more than 30,000 small businesses that purchased insurance from NEXT. Restaurants are defined as one of three types: quick service, casual dining and fine dining.

Payroll and revenue data are derived from user-supplied projections in NEXT insurance applications from January 1, 2021 to December 31, 2024.

Regional data was selected based on the states with at least 150 NEXT customers and then ranked on payroll and revenue.

Tong Zhang
About the author

Tong Zhang is a data scientist at NEXT. She partners with our insurance product teams to uncover important insights to drive product development and new customer initiatives. She previously worked in data analytics at Tesla.

Forward looking statements disclaimer

This report contains forward-looking statements that involve a number of risks, uncertainties and assumptions, including but not limited to statements regarding the expected growth and trends of restaurants. Any statements that are not statements of historical fact may be deemed to be forward-looking statements, and actual results could differ materially from those stated or implied in forward-looking statements.

This report also includes market data and certain other statistical information and estimates from industry analysts and/or market research firms. NEXT believes these third party reports to be reputable, but has not independently verified the underlying data sources, methodologies or assumptions. Information that is based on estimates, forecasts, projections, market research or similar methodologies is inherently subject to uncertainties and may differ materially from actual events or circumstances.

What we cover
Chat with Us

Mon – Fri | 8 a.m. – 5 p.m. CT

FacebookInstagramTiktokTwitterLinkedinYoutube
© 2024 Next Insurance, Inc. 975 California Ave, Palo Alto, CA 94304, United States
Better Business Bureau
Issuance of coverage is subject to underwriting. Not available in all states. Please see the policy for full terms, conditions and exclusions. Coverage examples are for illustrative purposes only. Your policy documents govern, terms and exclusions apply. Coverage is dependent on actual facts and circumstances giving rise to a claim. Next Insurance, Inc. and/or its affiliates is an insurance agency licensed to sell certain insurance products and may receive compensation from insurance companies for such sales. Policy obligations are the sole responsibility of the issuing insurance company. Refer to Legal Notices section for additional information.

** Coverage examples are for illustrative purposes only. Your policy documents govern, terms and exclusions apply. Coverage is dependent on actual facts and circumstances giving rise to a claim.

Any starting prices or premiums represented before an actual customer quote are not guaranteed and are representations of existing premiums of active policies as of December 6, 2023. To the extent permitted by law, applicants are individually underwritten, not all applicants may qualify. Individual rates and savings vary and are subject to change. Discounts and savings are available where state laws and regulations allow, and may vary by state. Certain discounts apply to specific coverages only.